E-Commerce Jewellery & Accessories
Her Zevar
From ₹22K to ₹2.93L in monthly store sales (~13.2× Growth)
Scaled an e-commerce jewellery brand from early traction to consistent multi-lakh monthly store revenue through disciplined Meta ad scaling, creative testing, and influencer collaborations.
Context & Momentum
What the data shows
A clear look at how monthly revenue, order velocity, and customer demand developed across the engagement.
Her Zevar is a direct-to-consumer jewellery brand targeting modern women with contemporary everyday styling pieces.
The engagement began in May 2026 with a baseline store revenue of ₹22,270 and 22 orders. The objective was to build scalable acquisition funnels on Meta Ads while leveraging influencer partnerships to generate trustworthy social proof.
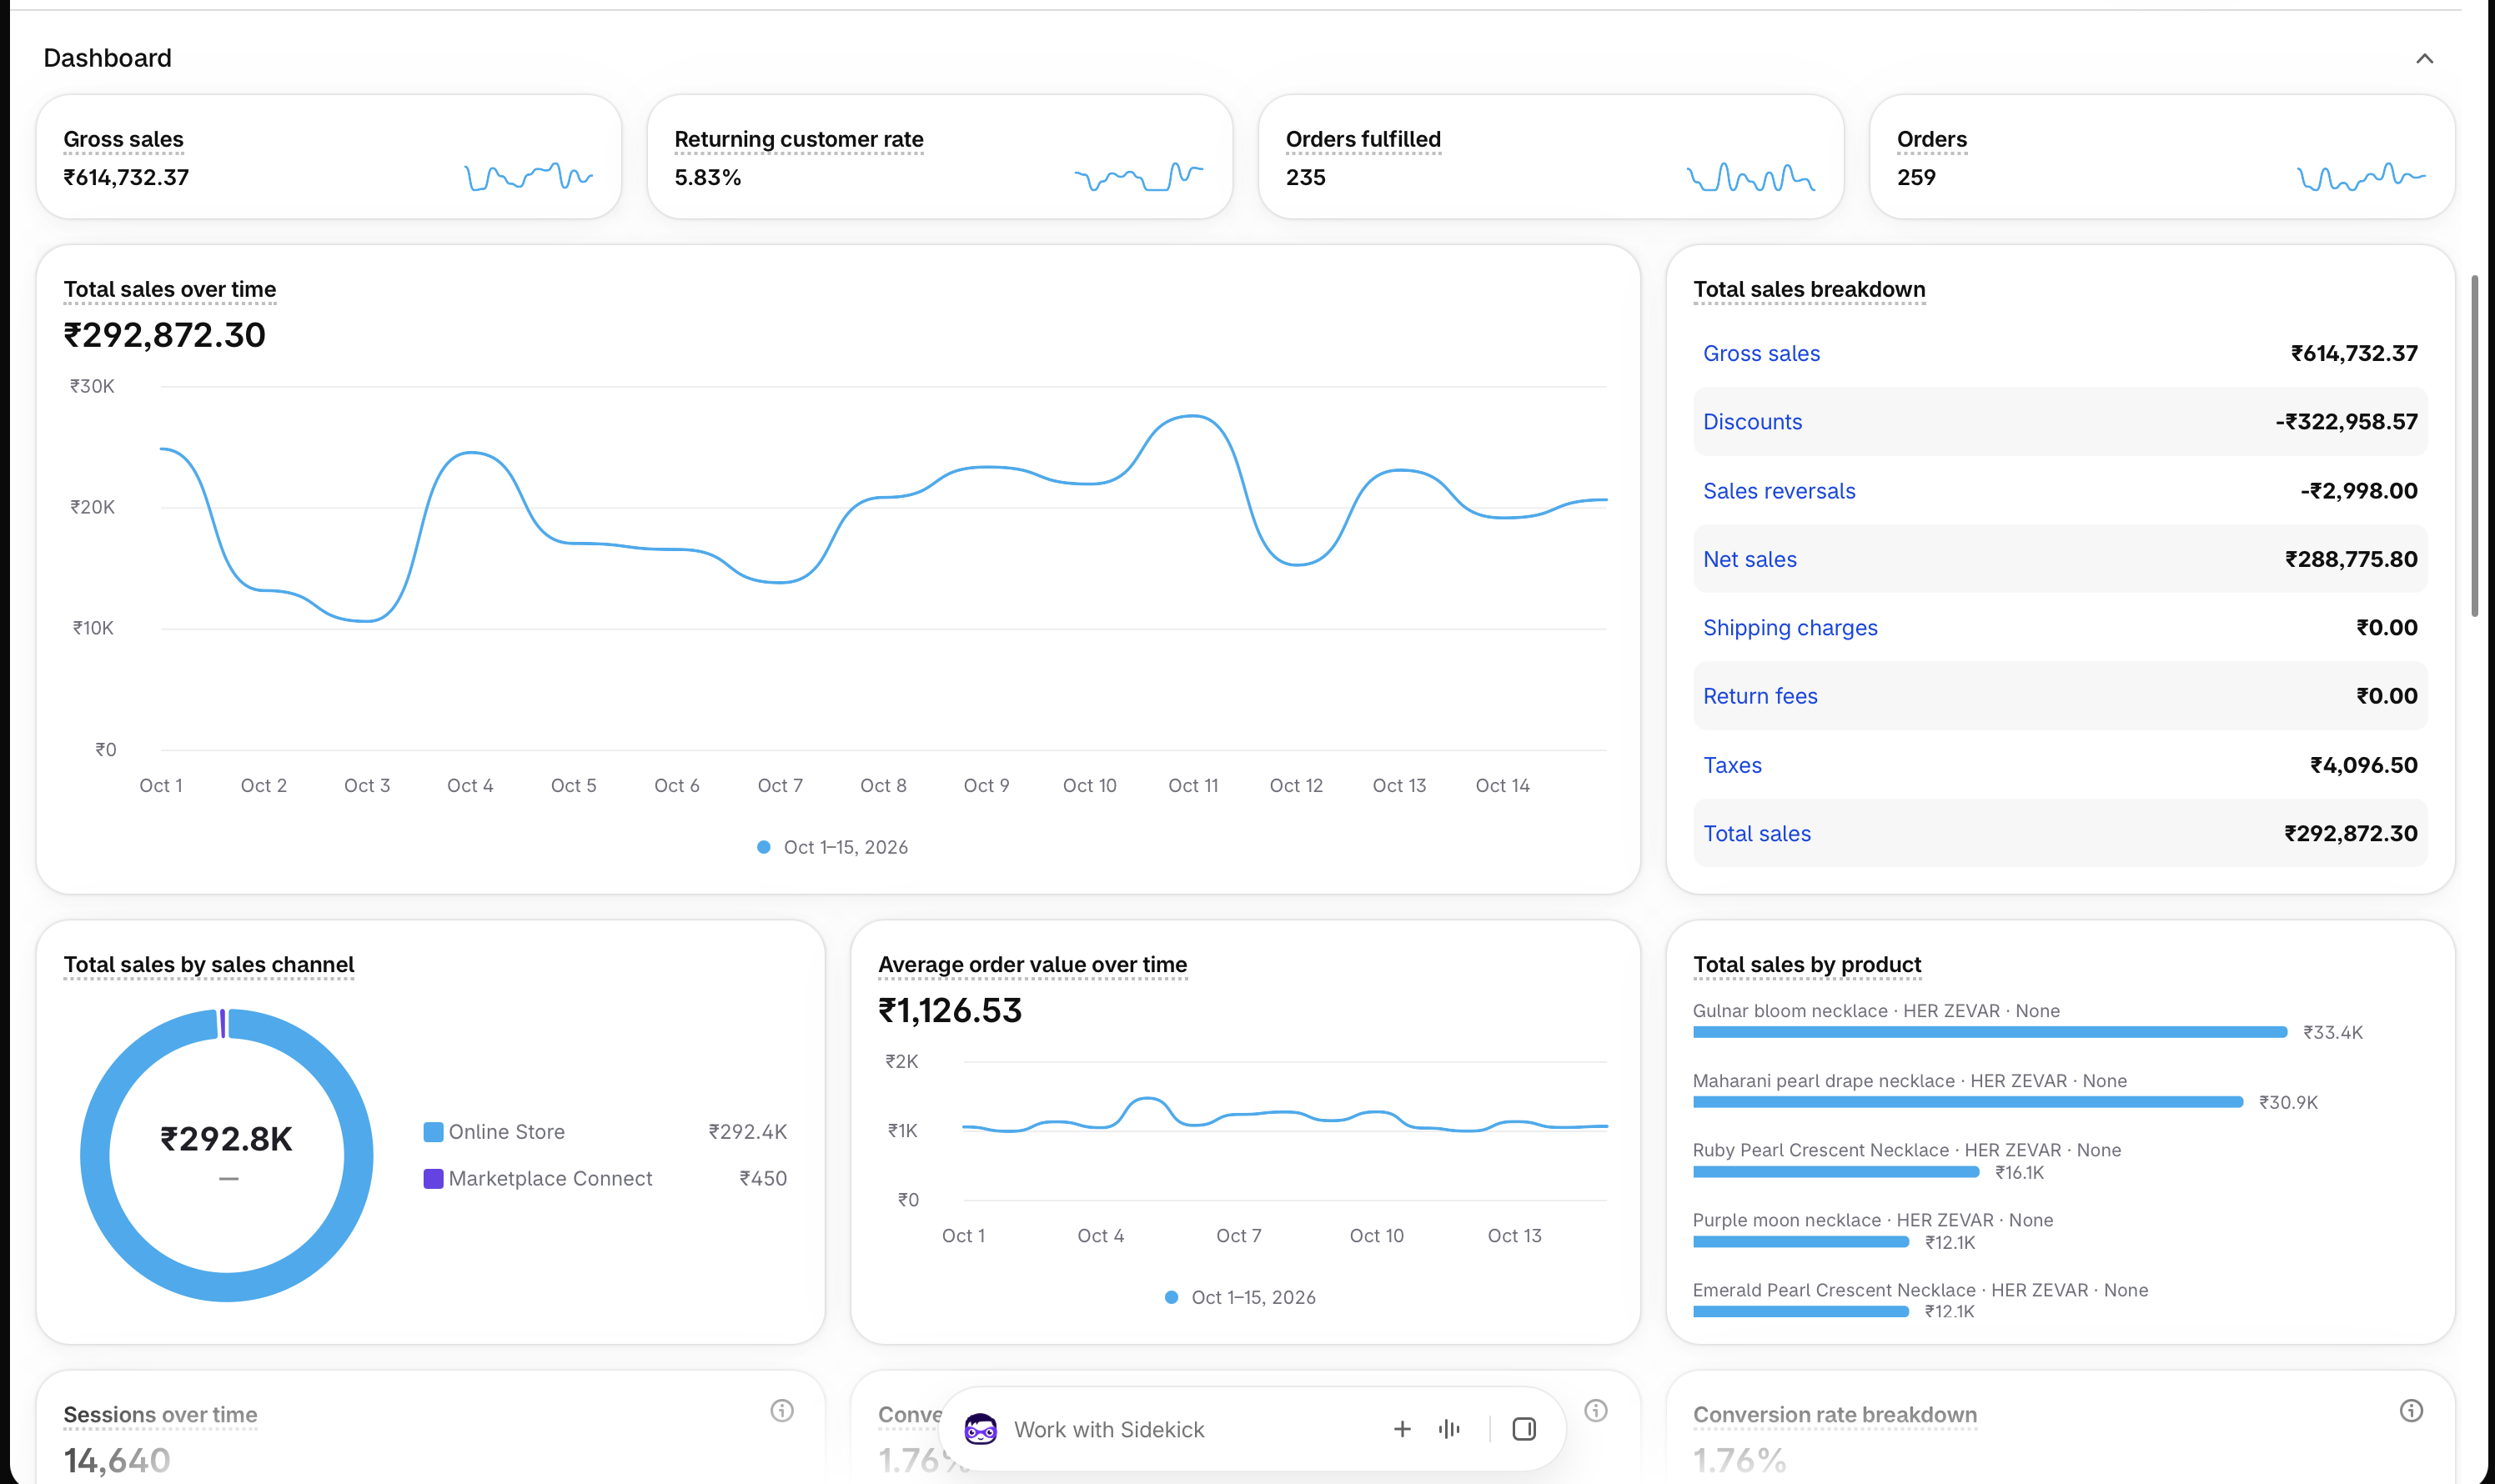
Across 5.5 months of continuous optimization, monthly store sales expanded consistently, crossing ₹1.43L in August, ₹3.32L in September, and generating ₹2.92L in just the first 15 days of October.
Sales Trend & Scale
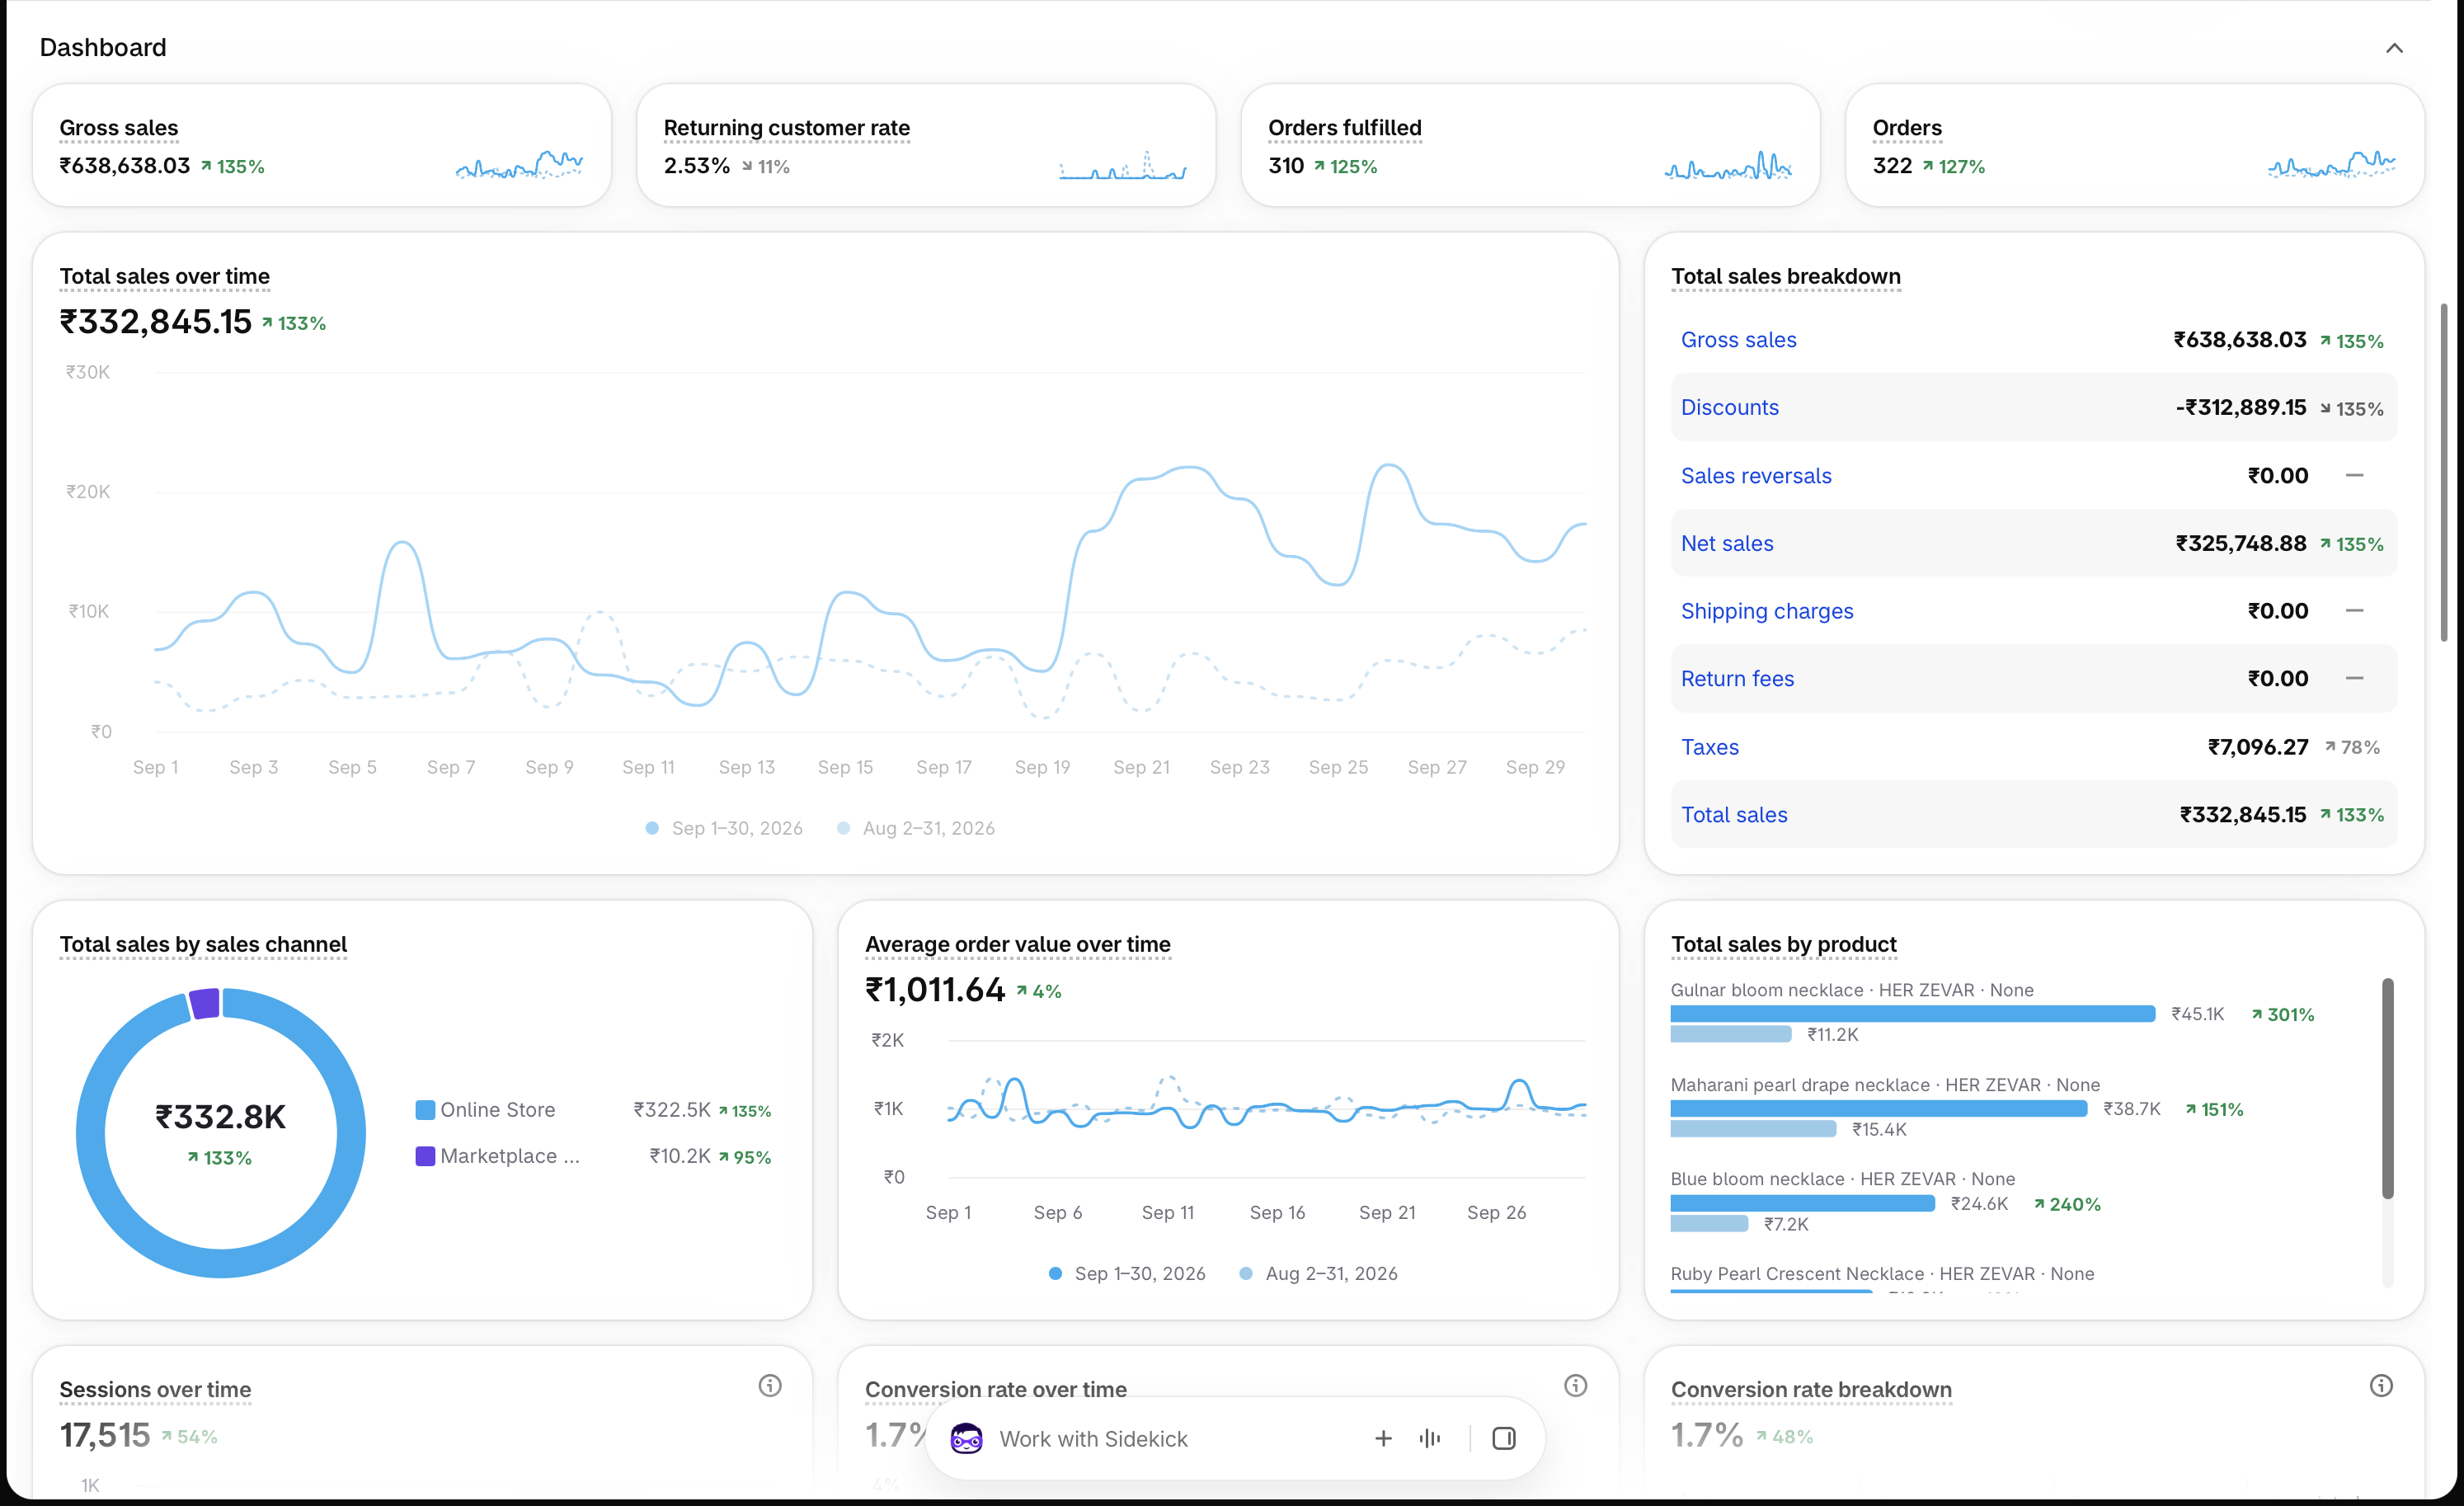
Reported monthly store sales escalated from ₹22.3K in May to ₹332.8K in September, establishing sustainable commercial momentum.
Order Volume Expansion
Orders expanded by more than 14×, jumping from 22 in May to 322 in September and 259 in the first half of October alone.
Conversion Efficiency
Store conversion rate climbed to a peak 1.76% in October 2026, lifting store profitability and return on ad spend.
Chronological Records
The numbers tell the story
Monthly breakdown of store sales, volume, and conversion trends reported during the active growth period.
| Period | Total Store Sales | Order Count | Conversion Rate | Strategic Focus |
|---|---|---|---|---|
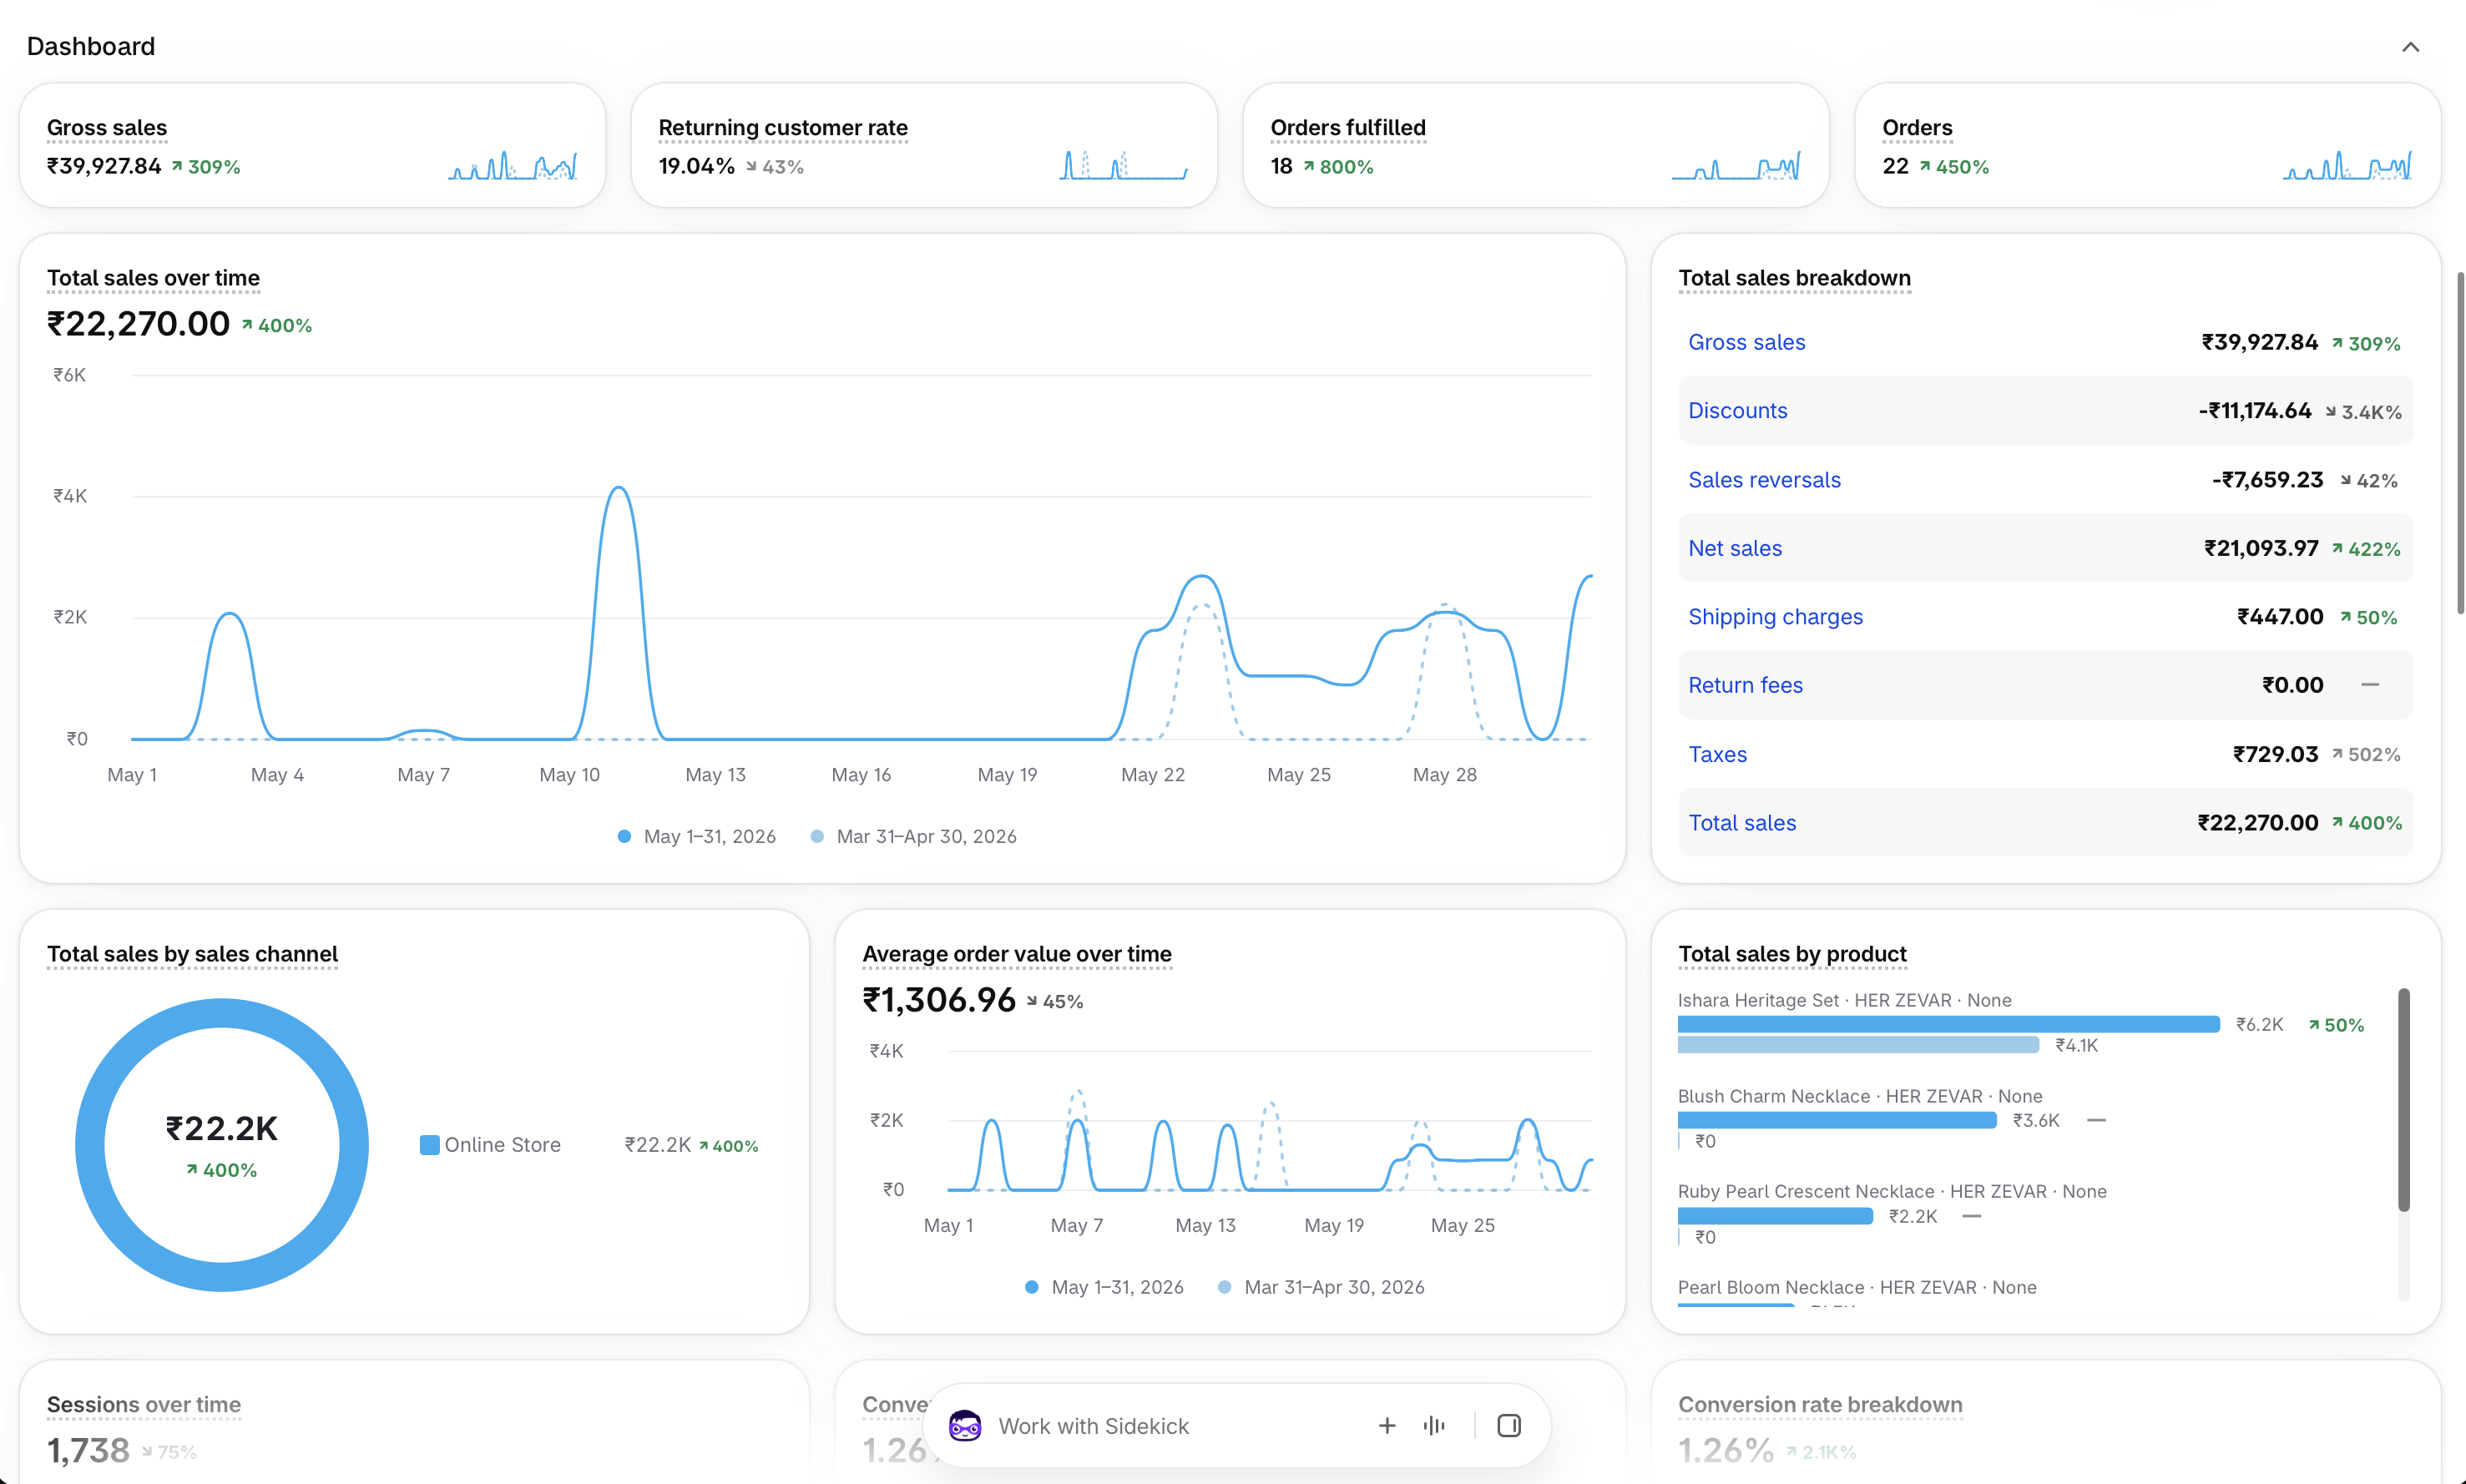
| May 2026 | ₹22,270 | 22 orders | 1.26% | Initial account setup and baseline testing |
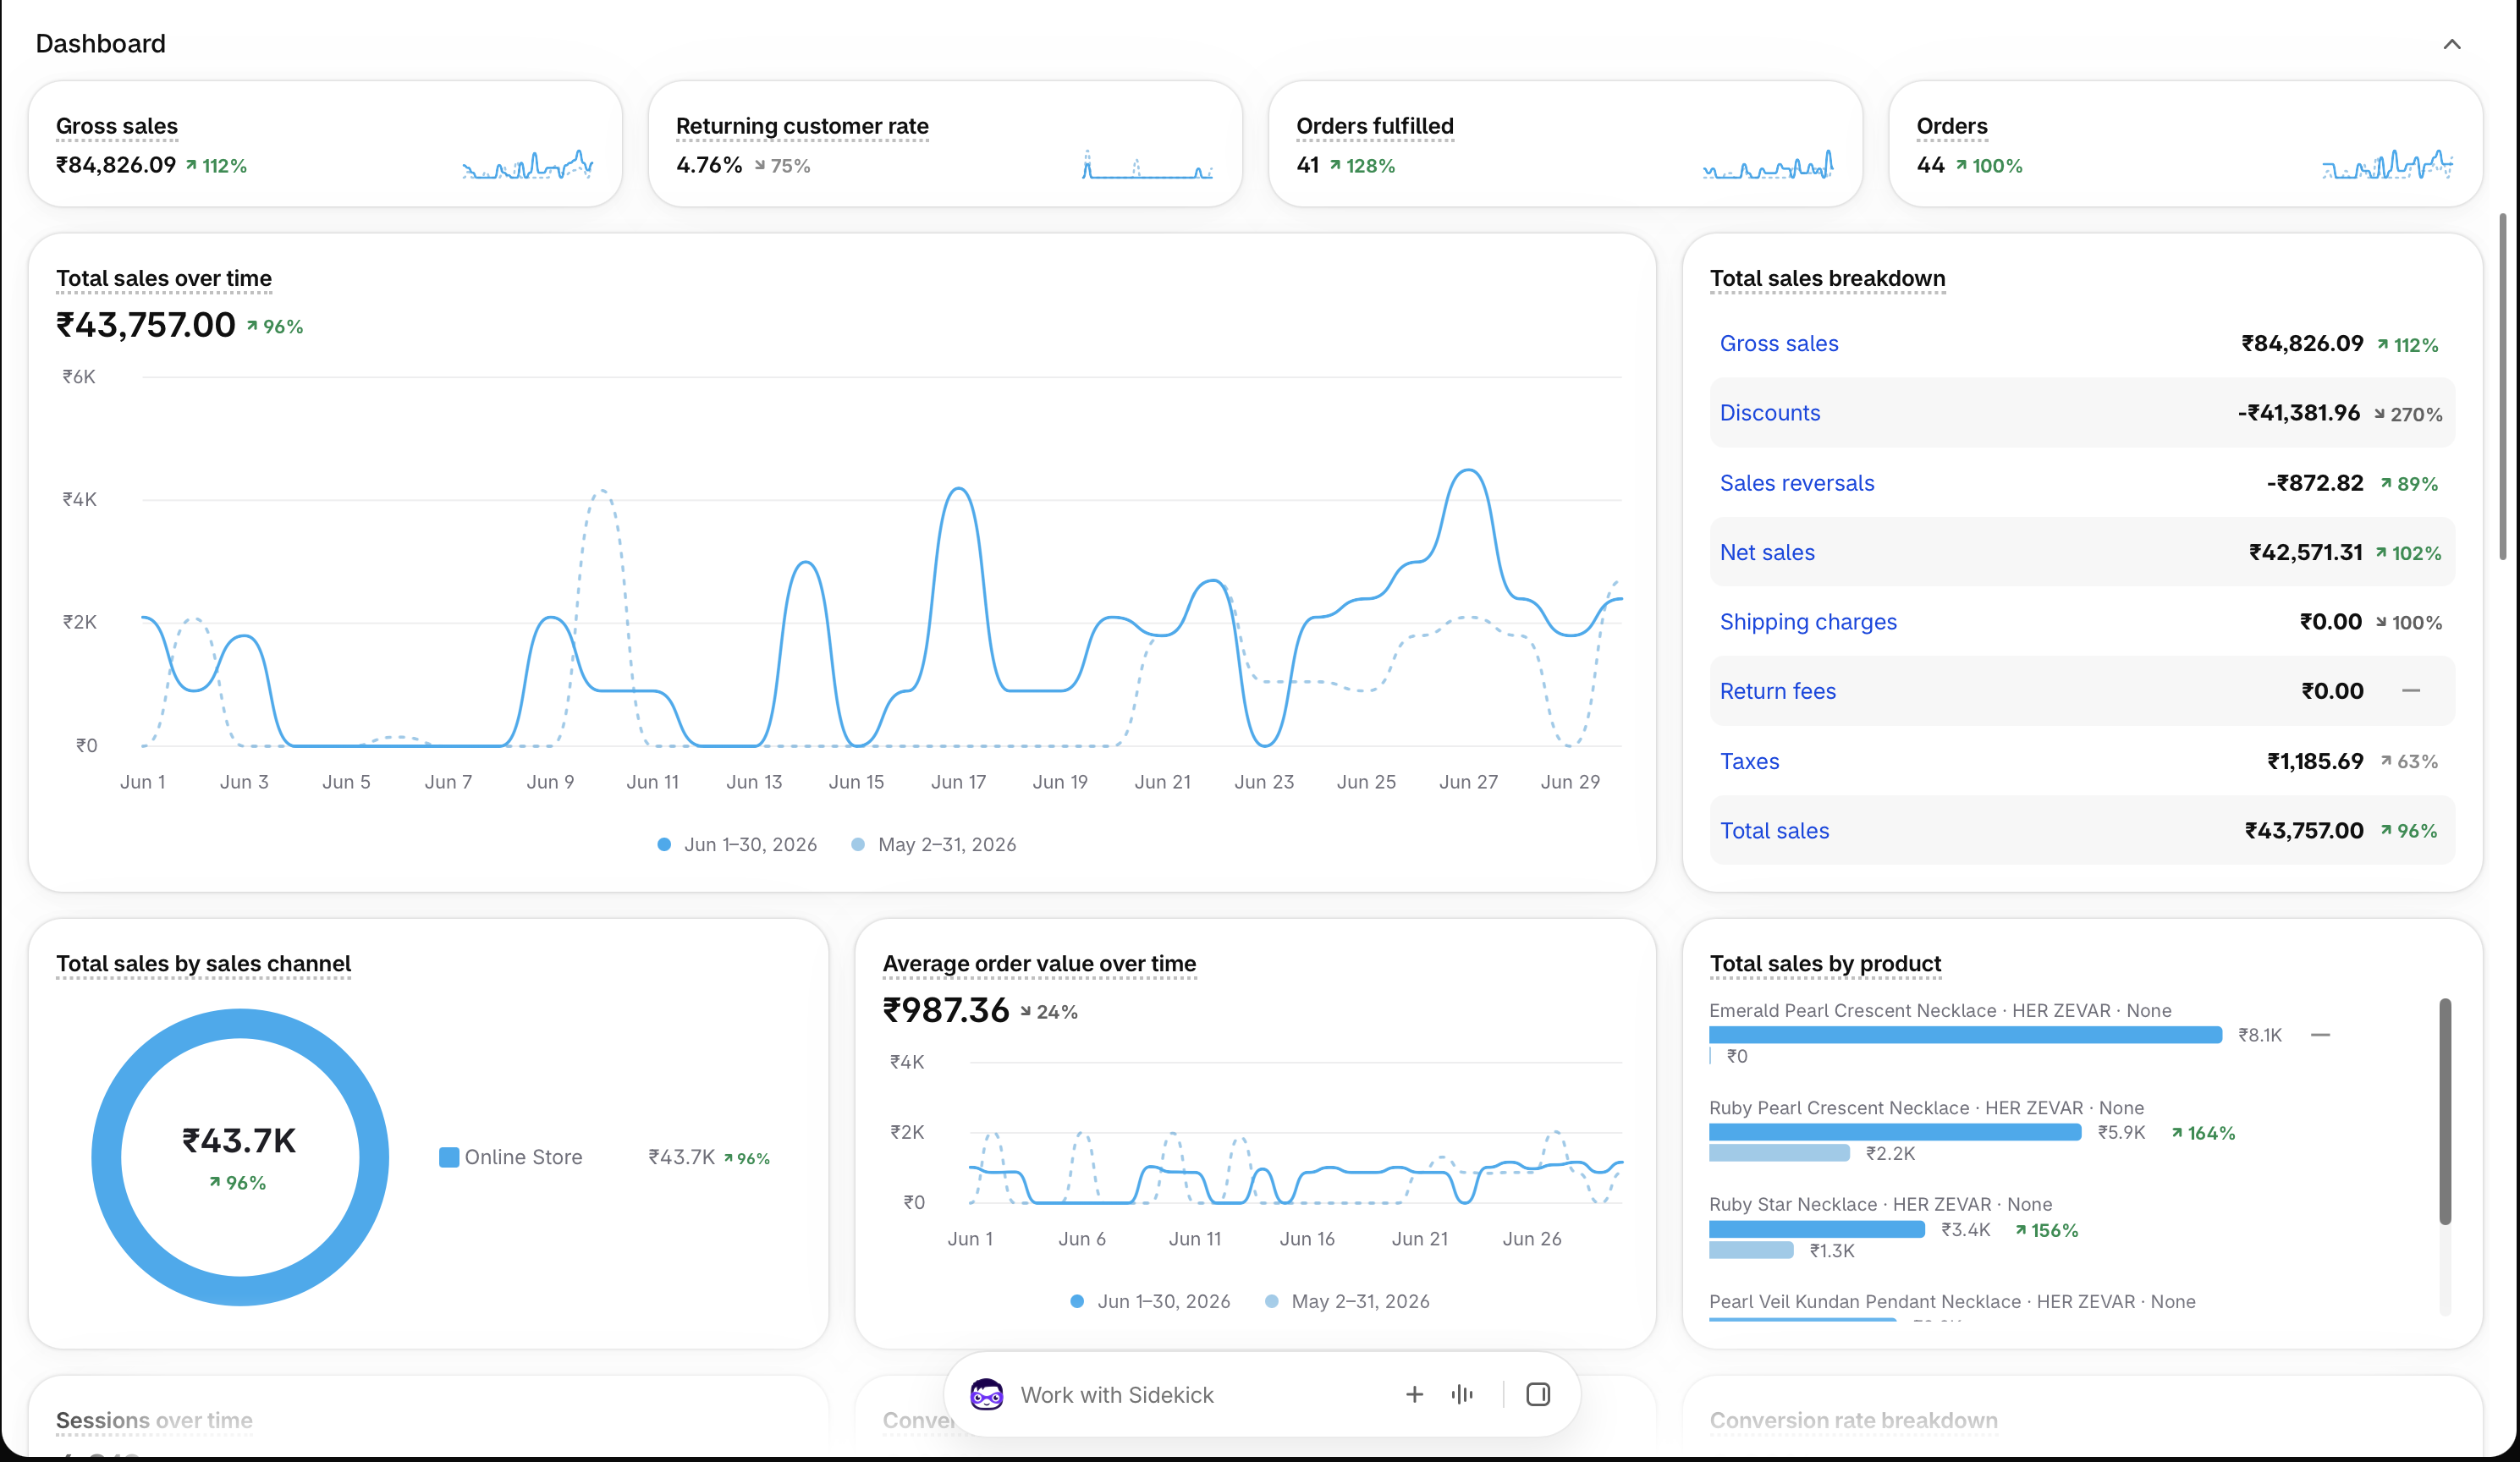
| June 2026 | ₹43,757 | 44 orders | 0.88% | 96% MoM sales growth; order volume doubled |
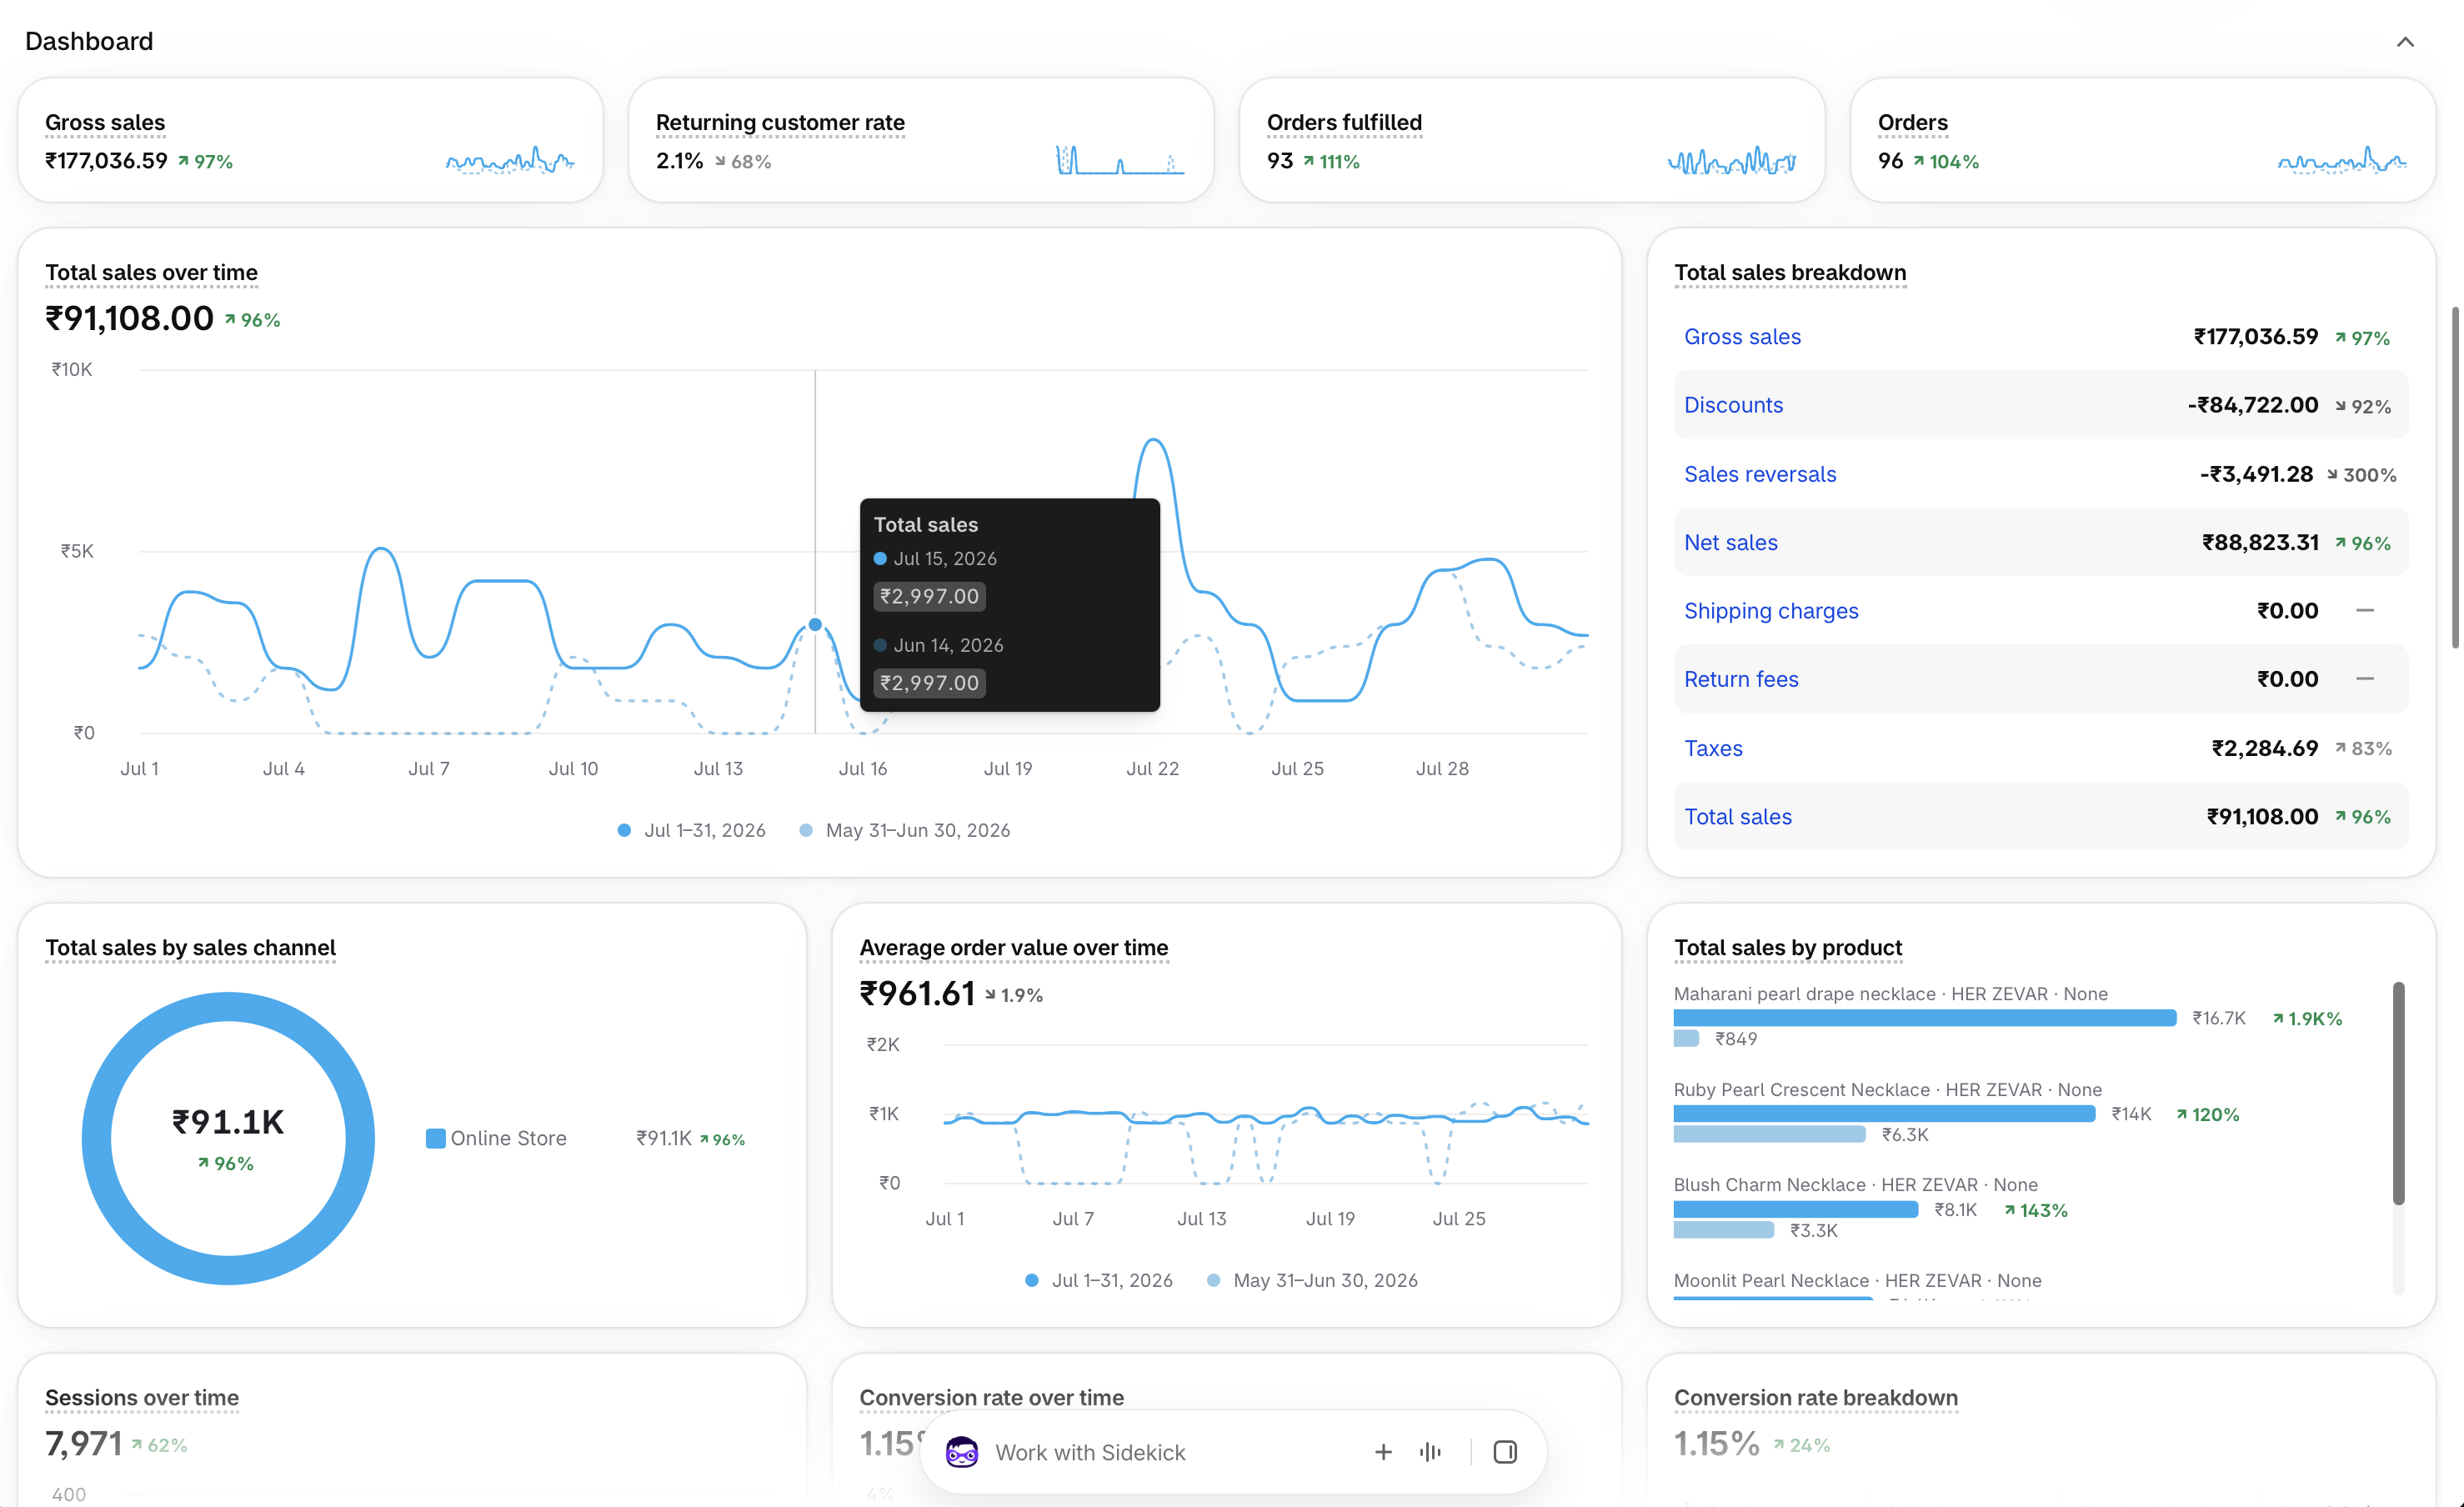
| July 2026 | ₹91,108 | 96 orders | 1.29% | 108% MoM growth; creative format iterations |
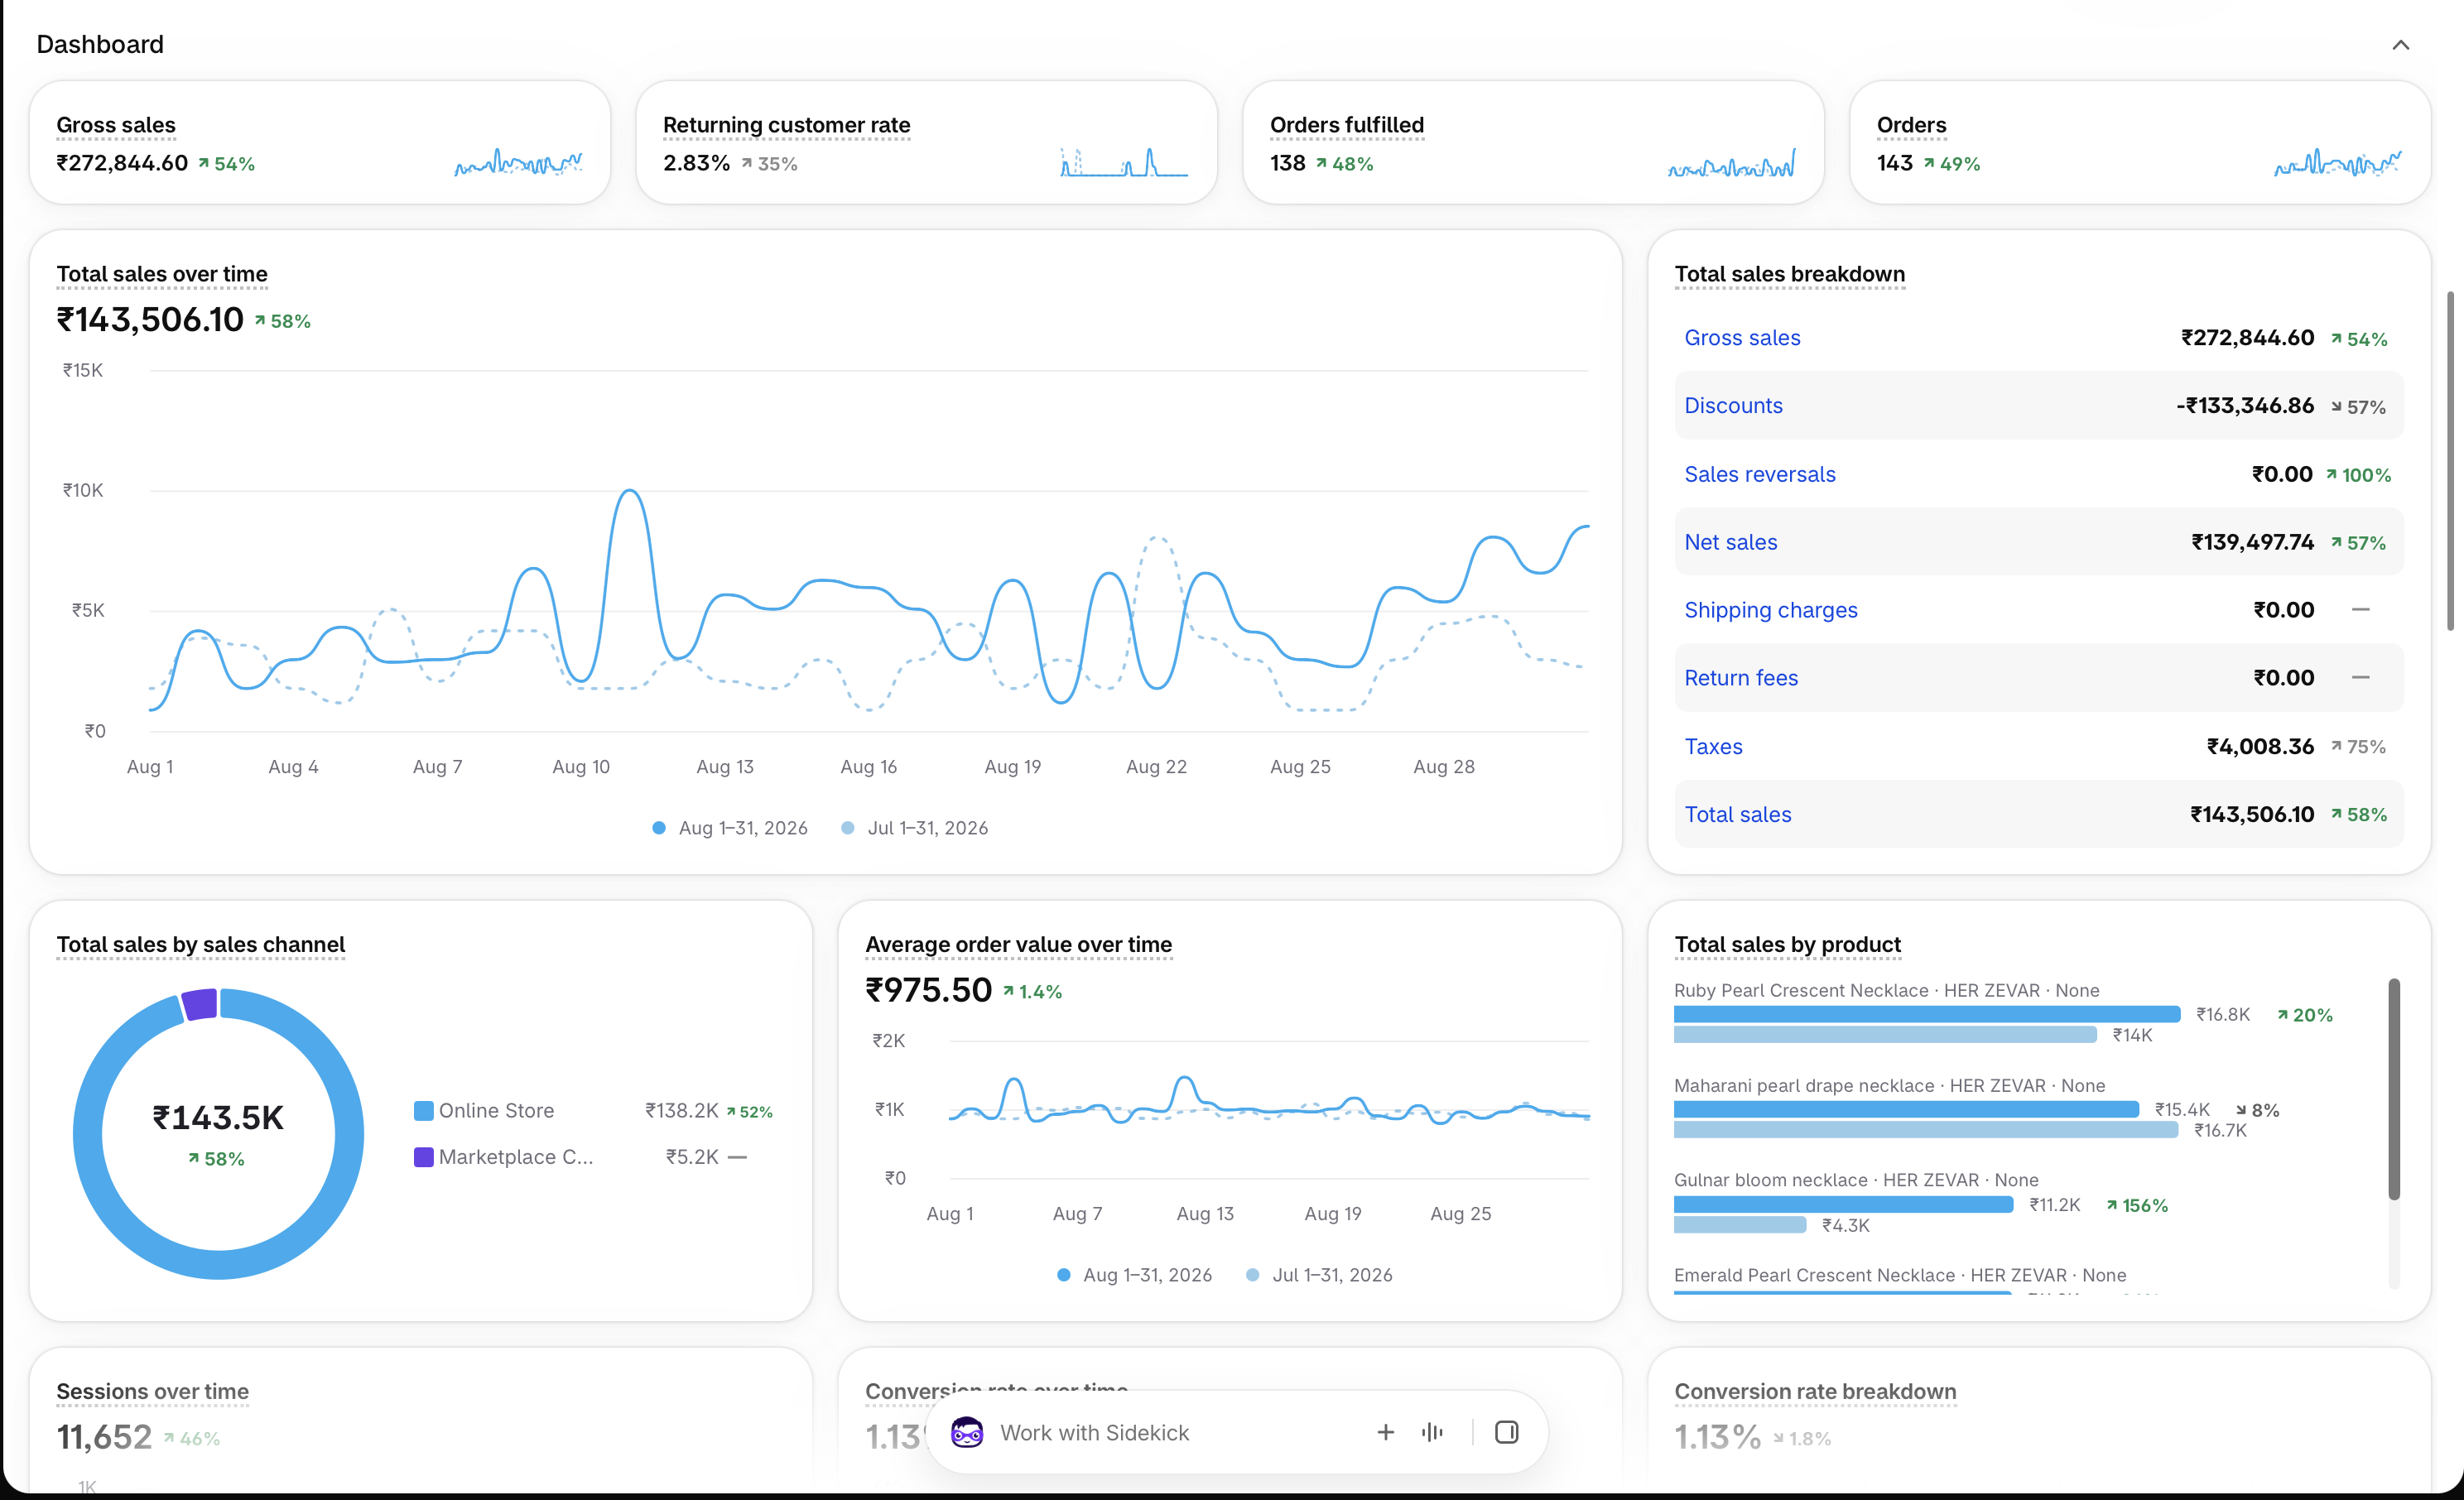
| August 2026 | ₹143,506 | 143 orders | 1.13% | 57% MoM growth; breaking the 6-figure revenue mark |
| September 2026Milestone | ₹332,845 | 322 orders | 1.70% | 131% MoM growth; peak recorded monthly sales |
| October 1–15, 2026Milestone | ₹292,872 | 259 orders | 1.76% | Partial 15-day sprint; on track for historic run-rate |
Audit Trail
Shopify dashboard snapshots
Direct reporting captures from client Shopify analytics verifying the month-over-month progression.
May 2026
Baseline period: ₹22,270 store sales with 22 orders at 1.26% conversion rate.
June 2026
First scaling milestone: ₹43,757 store sales with 44 orders.
July 2026
Reaching ₹91,108 store sales with 96 orders as ad testing matured.
August 2026
Crossing 6 figures: ₹143,506 in store sales across 143 orders.
September 2026
Peak performance month: ₹332,845 in sales, 322 orders, and 1.70% conversion rate.
October 1–15, 2026
Mid-month sprint: ₹292,872 in just 15 days, 259 orders at 1.76% conversion rate.
Execution Blueprint
Strategic levers behind the results
Specific campaign tactics, creative testing methods, and operational optimizations deployed.
Thumb-Stopping UGC & Try-On Briefs
Shifted creative focus from static catalogue jewellery shots to realistic lifestyle UGC, jewellery pairing guides, and festive outfit styling reels that reduced thumb-scroll fatigue.
Full-Funnel Testing Matrix
Iterated through broad audience targeting, interest stacking, and lookalikes paired with automated dynamic product ads (DPA) for abandoned carts.
Integrated Influencer Seeding
Coordinated micro-influencer gifting for authentic unboxing videos, translating influencer content directly into high-performing whitelisted ad variations.
Key Takeaway
Growth is more than a single metric
The intersection of acquisition, store performance, and unit economics.
Growth is compound: creative testing in June and July created the foundation for the massive Q3 revenue breakout.
Conversion rate improvements (1.13% to 1.76%) effectively reduced customer acquisition cost while revenue expanded 13.2×.
Pairing creator-driven authentic assets with direct-response ad structures delivers superior ROAS for visual consumer products.
Reporting Integrity Note
These metrics are overall Shopify store metrics reported directly from the client store analytics during the May 1 – October 15, 2026 engagement. October covers only October 1–15.