Luxury Apparel & Lifestyle D2C
The House of Destiny
+69.8% Order Growth & 47.8% Gross Sales Expansion
Executed full-funnel Meta Ads strategy for luxury lifestyle brand The House of Destiny in partnership with The Pencil Advertising, lifting April orders to 236 (+69.8%) and gross sales to ₹1.61L.
Context & Momentum
What the data shows
A clear look at how monthly revenue, order velocity, and customer demand developed across the engagement.
The House of Destiny is a modern lifestyle and fashion brand focusing on distinctive aesthetics and contemporary consumer appeal.
As part of paid social execution in collaboration with The Pencil Advertising, I managed Meta Ads strategy, campaign delivery, and creative iterations across Q1 2026.
Following initial account restructuring and returns reconciliation across January and February, campaigns achieved rapid acceleration in March and April 2026. From March to April, store-wide total sales rose by 36.6%, orders expanded from 139 to 236 (+69.8%), and gross sales climbed 47.8% to reach ₹160,998.
69.8% Order Acceleration
Customer order volume climbed from 139 orders in March to 236 orders in April through targeted top-of-funnel creative testing and audience segmentation.
47.8% Gross Sales Lift
Gross revenue expanded from ₹108,954 in March to ₹160,998 in April, reflecting stronger cart values and buyer velocity.
Honest Attribution & Verifiable Data
Grounded in verifiable Shopify dashboard reporting, aligning paid social traffic with real bottom-line store deliveries.
Chronological Records
The numbers tell the story
Monthly breakdown of store sales, volume, and conversion trends reported during the active growth period.
| Period | Total Store Sales | Order Count | Conversion Rate | Strategic Focus |
|---|---|---|---|---|
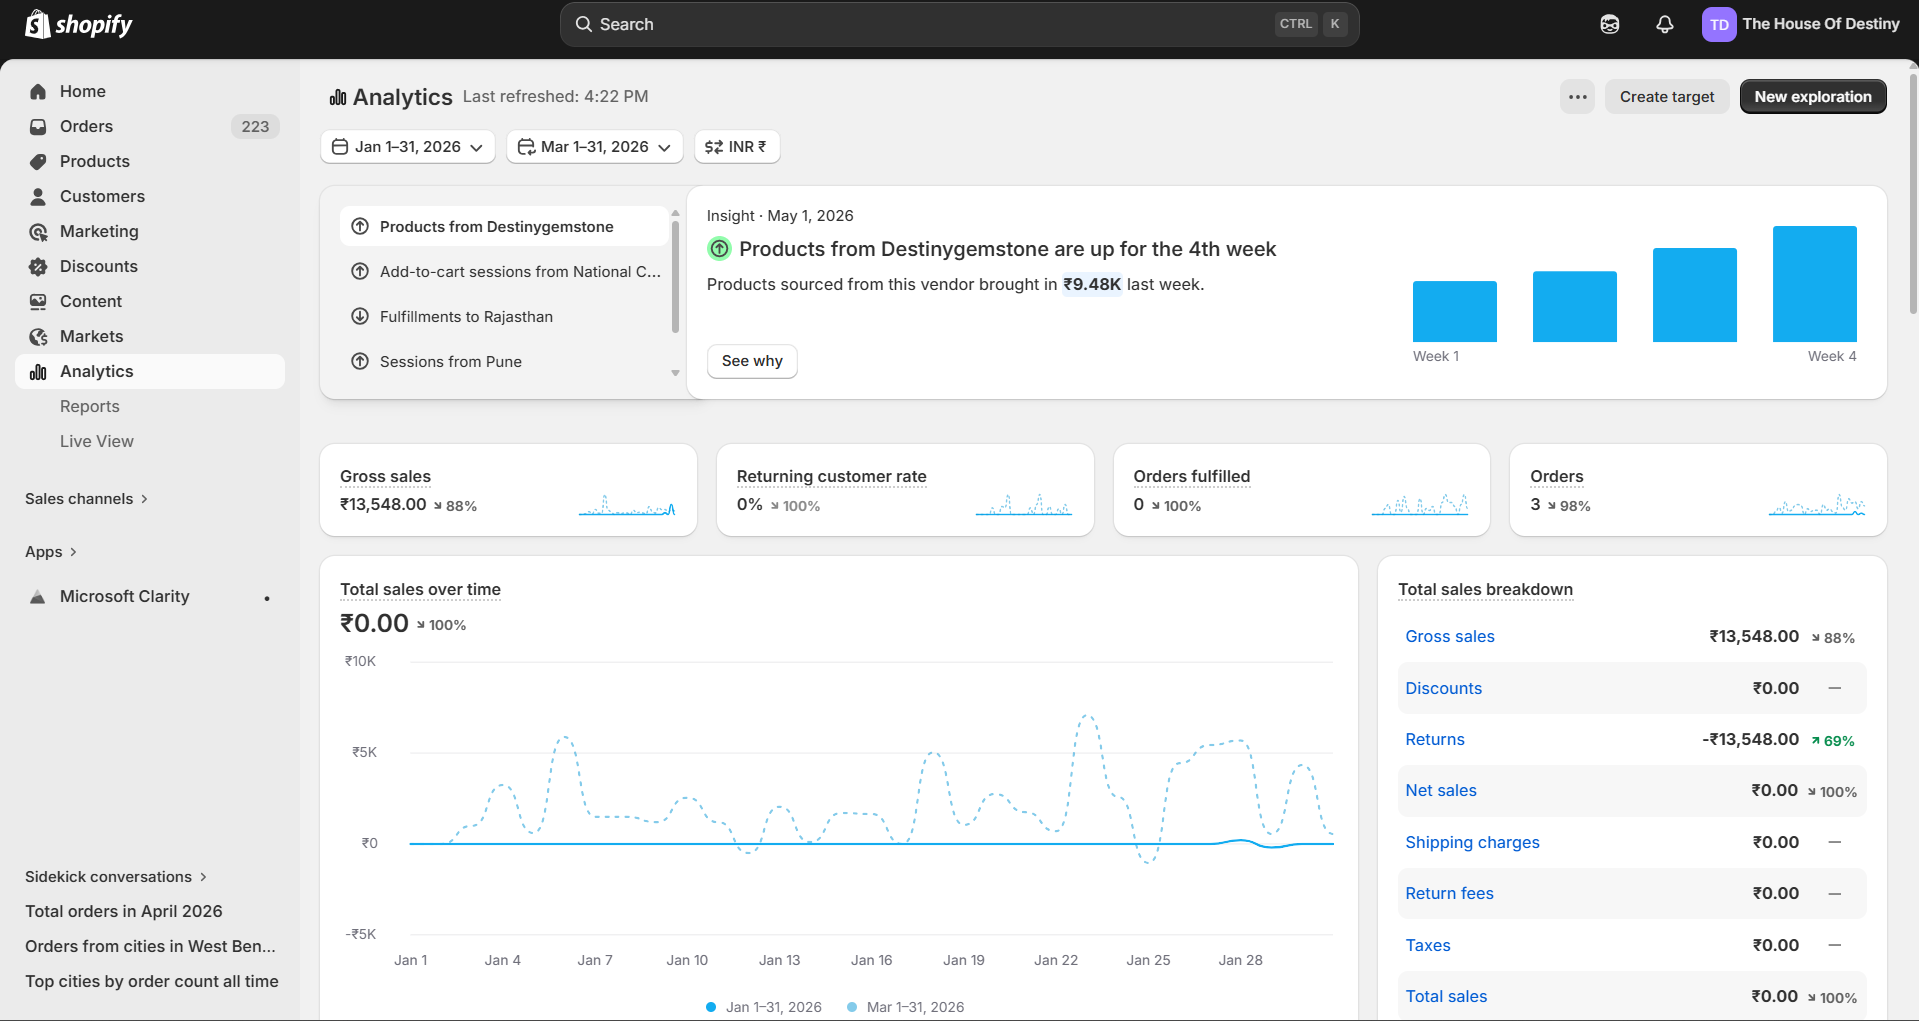
| January 2026 | ₹0 | 3 orders | — | Initial restructuring and account setup; gross sales ₹13,548 with large returns adjustments |
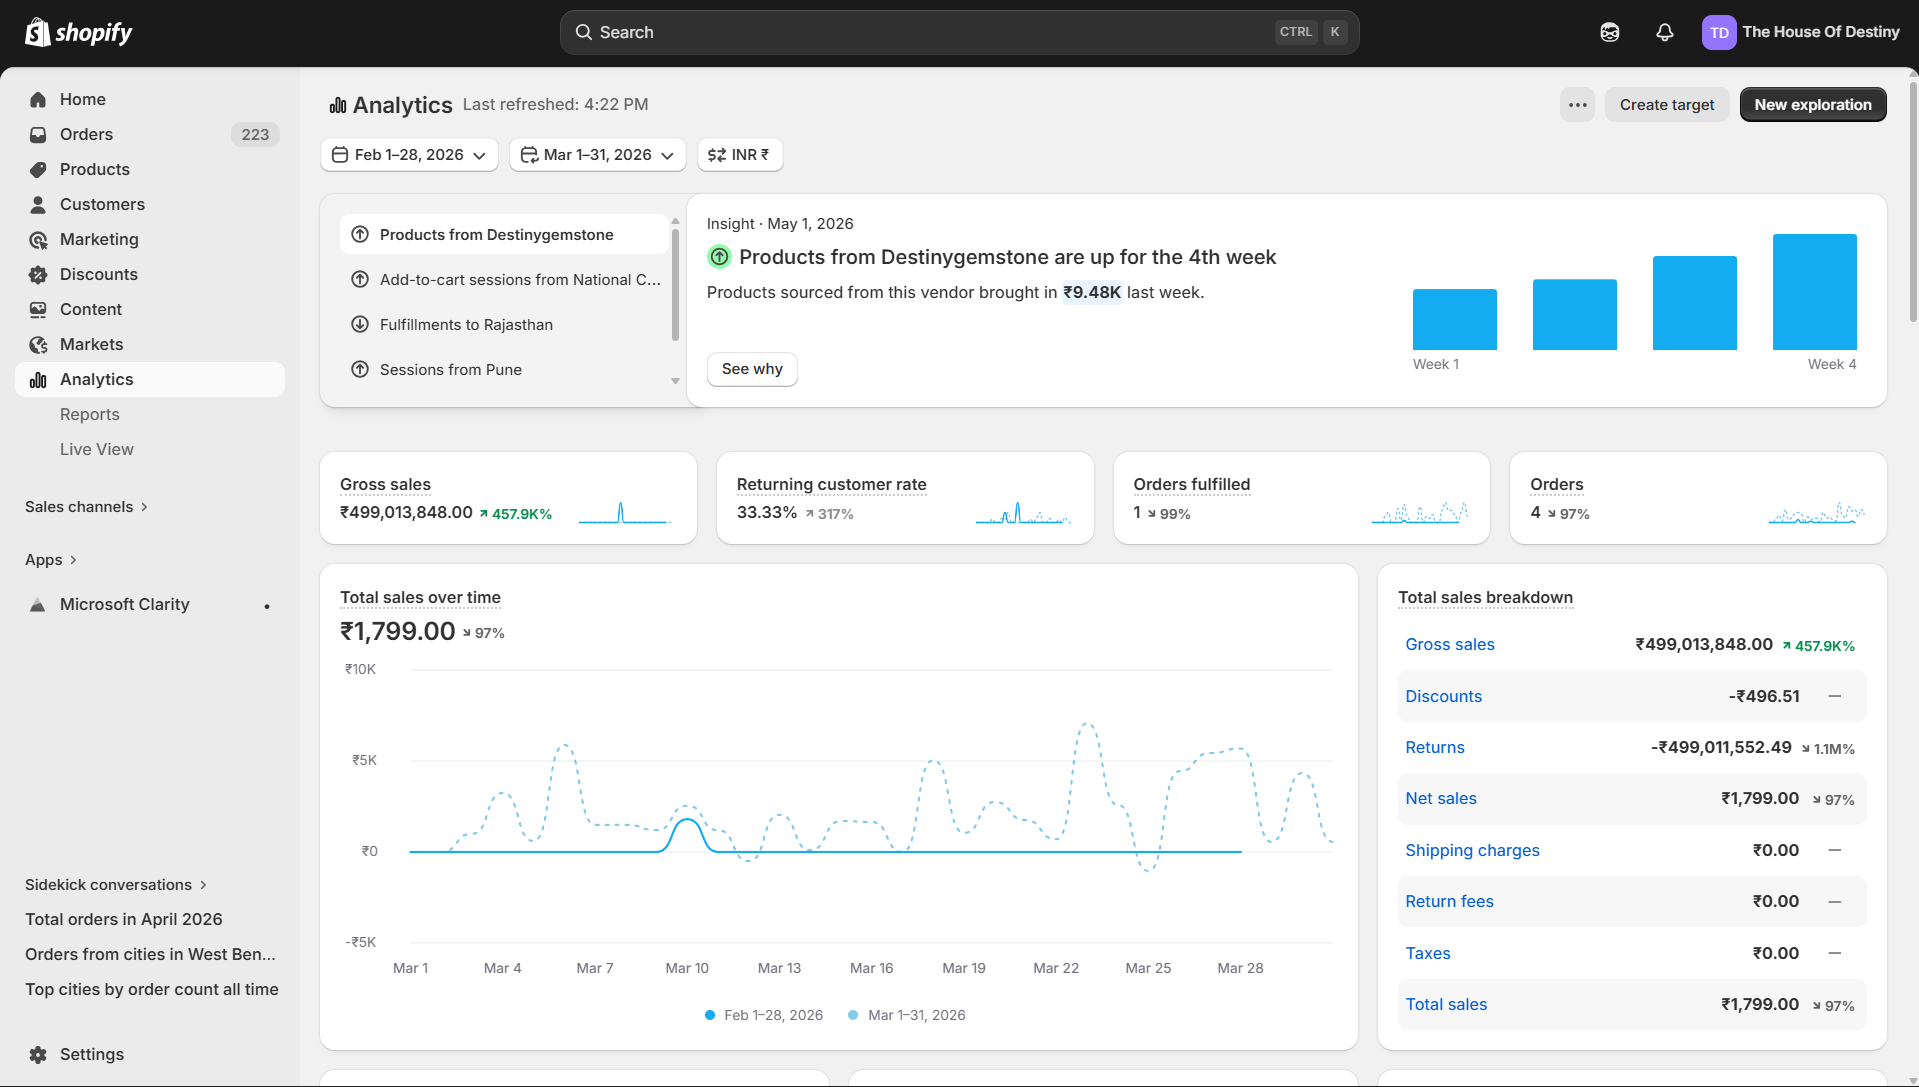
| February 2026 | ₹1.8K | 4 orders | — | Testing phase with returns reporting adjustments |
| March 2026Milestone | ₹64.6K | 139 orders | — | Scaling onset: ₹108,954 gross sales with 139 orders |
| April 2026Milestone | ₹88.2K | 236 orders | — | Peak sprint: +69.8% orders (236) and ₹160,998 gross sales |
Audit Trail
Shopify dashboard snapshots
Direct reporting captures from client Shopify analytics verifying the month-over-month progression.
January 2026
Baseline audit: ₹0 total sales (net of adjustments), 3 orders, gross sales ₹13,548.
February 2026
Account recovery & initial creative testing: ₹1,780 total sales, 4 orders.
March 2026
Commercial inflection: ₹64,570 total sales, 139 orders, and ₹108,954 gross revenue.
April 2026
Scaling breakthrough: ₹88,187 total sales (+36.6%), 236 orders (+69.8%), ₹160,998 gross sales.
Execution Blueprint
Strategic levers behind the results
Specific campaign tactics, creative testing methods, and operational optimizations deployed.
Aesthetic-First Product Visuals & Video Lookbooks
Replaced generic e-commerce product grids with stylized editorial lookbooks and dynamic video cuts emphasizing fabric drape and exclusivity.
Broad Targeting with Creative Segmentation
Allowed Meta's machine learning to discover luxury fashion buyers by testing diverse visual aesthetics across lifestyle contexts rather than over-restricting interests.
Cart Recovery & Scarcity Messaging
Implemented dedicated middle-and-bottom-funnel remarketing targeting engaged visitors and abandoned checkouts with limited-run batch alerts.
Key Takeaway
Growth is more than a single metric
The intersection of acquisition, store performance, and unit economics.
Lifestyle fashion conversion hinges on visual aspiration: elevating creative production unlocked immediate order volume growth.
Order volume surged 69.8% while gross sales rose 47.8%, confirming healthy buyer demand and strong repeat interest.
Honest reporting matters: distinguishing net from gross sales and acknowledging baseline adjustments builds long-term client trust.
Reporting Integrity Note
Delivered in partnership with The Pencil Advertising. Figures reflect store-wide Shopify analytics screenshots supplied for January–April 2026. March to April represents the primary comparable scaling period.